Problem
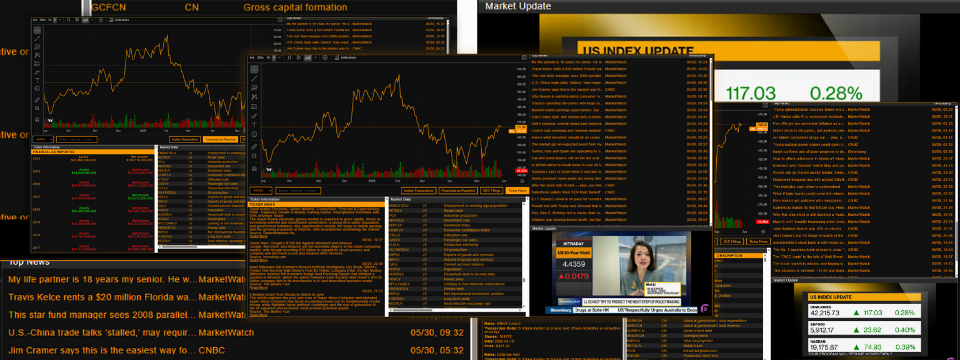
Financial data analysis needs many views of a company in one place: charts, insider transactions, financials as reported, SEC filings, ticker news and live news.
Goal
Replicate key features of a Bloomberg Terminal in a web application for comprehensive financial data analysis.
Plan
- Decision: build it as a web application so it opens in any browser.
- Decision: focus on the key features (charting, insider transactions, financials, filings and news) rather than the whole terminal.
Build process
- Charting: Built interactive charting for exploring price data.
- Company data: Added Insider Transactions, Financials as Reported and SEC Filings.
- News: Integrated ticker news and live news feeds.
Final product
- Interactive charts.
- Real-time Insider Transactions.
- Financials as Reported and SEC Filings.
- Ticker news and integrated live news feeds.
Lessons
- Bringing several data sources together is what makes a dashboard useful.
- Real-time data needs a clear, focused interface to stay readable.